Excel Charting Elements
|
|
|
|
|
|
|
|
|
|
|
|
|
|
Excel Charting Elements
Additional Resources
Excel Charting Elements
Excel Charting Elements
Excel Charting Elements | Microsoft Excel XP | Page 5 |
 |
Changing A Charts Gridlines
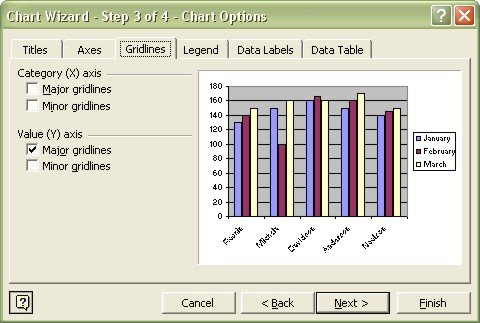
Gridlines are one of the important Excel charting elements. It can help you determine what the chart series represents numerically. Gridlines simply extend the tick marks on the axes.To add or remove gridlines, follow these steps:
| 1. | Activate the chart. |
| 2. | Choose Chart ► Chart Options from the menu bar. |
| 3. | Click the Gridlines tab. |
 |
|
| 4. | Check or Uncheck the check boxes that correspond to the desired gridlines. |
| 5. | Once you're done, click OK. |
 |
Each axis has two sets of gridlines: Major units are the ones displaying a label. Minor units are those in between. If you're working with a 3-D chart, the dialog box has options for three sets of gridlines. |
Rotating And Elevating A 3D Chart
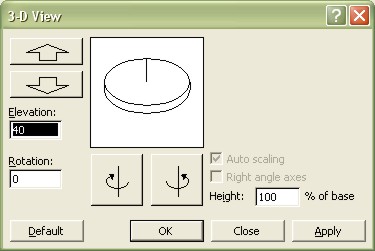
Sure, they're neat to look at, but when you work with 3-D charts, you may find that some data is completely or partially obscured. Damn! How can you convince the big executives at the Annual Sales Meeting that you aren't completely inept? Lucky for you, you can rotate the chart so that it shows the data better.Remember that Rotation and Elevation can only be done to a 3D chart type.
To change the rotation or elevation, follow these steps:
| 1. | Activate the 3D chart. |
| 2. | Choose Chart ► 3-D View from the menu bar. |
 |
|
| 3. | In the 3-D View dialog box, make rotations and elevation changes by clicking the appropriate controls. |
| 4. | Click OK (or click APPLY to see the changes without closing the dialog box). |
Excel XP Topics
- Tips- Excel Screen Layout
- Navigational Techniques
- Working with Workbooks
- Templates
- Working with Worksheets
- Moving Around
- Move Worksheets
- Copy Worksheets
- Insert & Delete Cells
- Insert & Delete Rows
- Insert & Delete Columns
- Resize Row
- Resize Column
- Editing Data
- Content Color
- Cell Color
- Number Formats
- Fonts
- Alignment
- Text Direction
- Indent Contents
- Merge Cells
- Copy
- Move
- Undo & Redo
- Using Zoom
- Freeze & Unfreeze Titles
- Split Worksheet
- Spreadsheet Data
- AutoFill
- AutoComplete
- Comment
- Find
- Replace
- Spellcheck
- Formulas
- Functions
- Password
- Sorting
- AutoFilter
- Advanced Filter
- Macros
- Charts
- Charting
- Charting Elements
- Gantt Chart
- PivotTable
- PivotTable Calculations
- PivotTable Layout
- PivotTable Format
- PDF to Excel
- PDF-to-Excel Converter
- Excel to PDF Converter