Excel Charting
|
|
|
|
|
|
|
|
|
|
|
|
|
|
Additional Resources
Excel Charting | Microsoft Excel XP |
 |
 |
What's on this page... Using the Chart Wizard Chart Wizard - STEP 1 Chart Wizard - STEP 2 Chart Wizard - STEP 3 Chart Wizard - STEP 4 Changing the Chart Type Changing a Chart's Location See also... Charts Modify Chart Elements |
Using The Chart Wizard
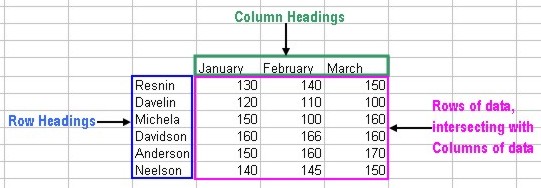
Doing Excel Charting with the Chart Wizard makes it easier for you to create a chart. The Chart Wizard consists of a series of four dialog boxes that prompt you for various settings for the chart. By the time you reach the last dialog box, the chart will usually be exactly what you need.Before starting the Chart Wizard, your source data need to be usable for a chart.
In Excel charting your source data should consist of:
| ► | Rows of data, intersecting with... |
| ► | Columns of data |
| ► | Row headings |
| ► | Column headings |
 |
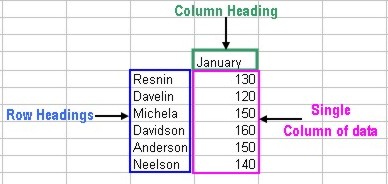
In Excel charting using Pie and Doughnut chart types your data should consist of:
| ► | Single rows (or columns) of data |
| ► | Row heading(s) |
| ► | Column heading(s) |
for example...
 |
| OR... |
 |
To create Excel charting using the Chart Wizard, follow these steps:
| 1. | Before you start the Chart Wizard, you must select the
data that you want to include in the chart. Include in your selection items such as labels and series identifiers. The data that you're plotting doesn't have to be contiguous. You can press CTRL while making a multiple selection. |
| 2. | After
selecting the data, start the Chart Wizard by clicking
the Chart Wizard button on the Standard toolbar. OR Choose Insert ► Chart from the menu bar. |
 |
While using the Chart Wizard, you can go back to the previous step by clicking the BACK button. Or you can click FINISH to end the Chart Wizard. If you end it early, Excel creates the chart using the information you provided up to that point. |
| See also.. Charts | Modify Chart Elements |
| Back to Top |
| Return to Excel XP from Excel Charting |
Excel XP Topics
- Tips- Excel Screen Layout
- Navigational Techniques
- Working with Workbooks
- Templates
- Working with Worksheets
- Moving Around
- Move Worksheets
- Copy Worksheets
- Insert & Delete Cells
- Insert & Delete Rows
- Insert & Delete Columns
- Resize Row
- Resize Column
- Editing Data
- Content Color
- Cell Color
- Number Formats
- Fonts
- Alignment
- Text Direction
- Indent Contents
- Merge Cells
- Copy
- Move
- Undo & Redo
- Using Zoom
- Freeze & Unfreeze Titles
- Split Worksheet
- Spreadsheet Data
- AutoFill
- AutoComplete
- Comment
- Find
- Replace
- Spellcheck
- Formulas
- Functions
- Password
- Sorting
- AutoFilter
- Advanced Filter
- Macros
- Charts
- Charting
- Charting Elements
- Gantt Chart
- PivotTable
- PivotTable Calculations
- PivotTable Layout
- PivotTable Format
- PDF to Excel
- PDF-to-Excel Converter
- Excel to PDF Converter