
Excel Charts
|
|
|
|
|
|
|
|
|
|
|
|
|
|
Excel Charts
Additional Resources
Excel Charts
Excel Charts | Microsoft Excel XP |
 |
When you show your data to someone, wouldn't it be great to put that data into a visual form? Excel XP helps you convert data into chart form so that your data is more than an abstract jumble of text and numbers.
Of course, you can create many different types of charts, including the standard favorites such as bar, pie, line, and scatter charts.
You can also choose from variants such as column and area charts, or explore chart types such as bubble, cylinder, cone, and pyramid.
 |
What's on this page... Types of Charts Chart Elements See also... Excel Charting with the Chart Wizard Modify Chart Elements |
Types of Charts
There is a wide variety of chart types that you can choose from, but choosing the right type of chart can seem like a very daunting task.Here is a list of charts that makes the most sense in using to display your data graphically.
For data with multiple columns and rows use:
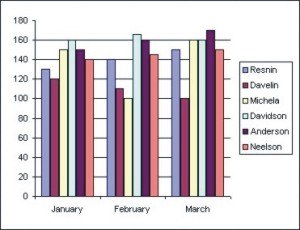
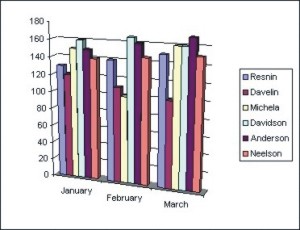
| 2D Column Chart | 3D Column Chart |
| Compares values across categories | |
 |
 |
| You can also use the Cylinder, Cone or Pyramid chart types. These are the same as a Column Chart only in the shape of a cylinder, cone or pyramid. They are also in 2D and 3D. | |
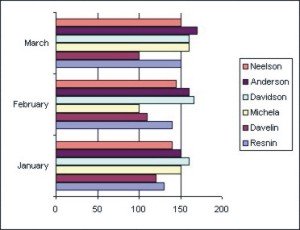
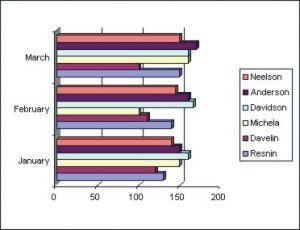
| 2D Bar Chart | 3D Bar Chart |
| Compares values across categories | |
 |
 |
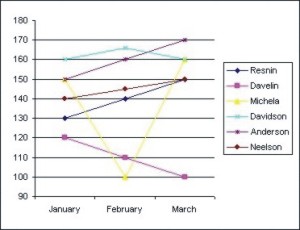
| 2D Line Chart | |
| Line with markers displayed at each data value | |
 |
|
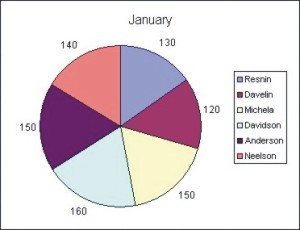
For data with multiple columns and a single row (or vice versa) use:
| 2D Pie Chart | 3D Pie Chart |
| Displays the contribution of each value to a total | |
 |
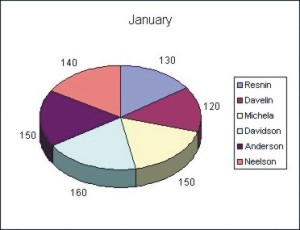 |
Chart Elements
The best way to understand your chart is to understand the chart elements. This way you know exactly what to change in the chart options.The best way to see what each part of the chart is, is to place your mouse pointer over an element and hold it still. A tooltip pops-up and gives the name description of the specific element that you are pointing at.
| See also.. Charting with the Chart Wizard | Modify Chart Elements |
| Back to Top |
| Return to Excel XP from Excel Charts |
Excel XP Topics
- Tips- Excel Screen Layout
- Navigational Techniques
- Working with Workbooks
- Templates
- Working with Worksheets
- Moving Around
- Move Worksheets
- Copy Worksheets
- Insert & Delete Cells
- Insert & Delete Rows
- Insert & Delete Columns
- Resize Row
- Resize Column
- Editing Data
- Content Color
- Cell Color
- Number Formats
- Fonts
- Alignment
- Text Direction
- Indent Contents
- Merge Cells
- Copy
- Move
- Undo & Redo
- Using Zoom
- Freeze & Unfreeze Titles
- Split Worksheet
- Spreadsheet Data
- AutoFill
- AutoComplete
- Comment
- Find
- Replace
- Spellcheck
- Formulas
- Functions
- Password
- Sorting
- AutoFilter
- Advanced Filter
- Macros
- Charts
- Charting
- Charting Elements
- Gantt Chart
- PivotTable
- PivotTable Calculations
- PivotTable Layout
- PivotTable Format
- PDF to Excel
- PDF-to-Excel Converter
- Excel to PDF Converter