Excel Gantt Chart
|
|
|
|
|
|
|
|
|
|
|
|
|
|
Excel Gantt Chart
Additional Resources
Excel Gantt Chart
Excel Gantt Chart | Microsoft Excel XP |
 |
A Gantt chart is a type of bar chart that illustrates a project schedule.
Gantt charts illustrate the start and finish dates of the terminal elements and summary elements of a project. Terminal elements and summary elements comprise the work breakdown structure of the project. Some Gantt charts also show the dependency (i.e., precedence network) relationships between activities. Gantt charts can be used to show current schedule status using percent-complete shadings and a vertical "TODAY" line.
Although now regarded as a common charting technique, Gantt charts were considered revolutionary when they were introduced.
This chart got its name from Henry Gantt and his contributions in management and community service.
This chart is used also in Information Technology to represent data that have been collected.
 |
What's on this page... Data Requirements Creating a Gantt Chart See also... Excel Charting Elements |
Data Requirements For An Excel Gantt Chart
There are several ways to create a Gantt chart. The most popular program to use is Microsoft Project, a task-planning program, which makes it easy to track and chart project timelines with a built-in Gantt chart view.You can also use Excel for this purpose. But, in using Excel you can only create a small and simple Excel Gantt chart which doesn't get too complicated.
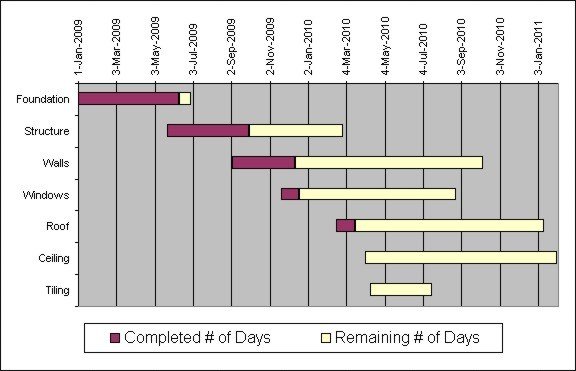
Excel does not contain a built-in Gantt chart format, however, you can create a Gantt chart in Excel by customizing the Stacked Bar chart type.
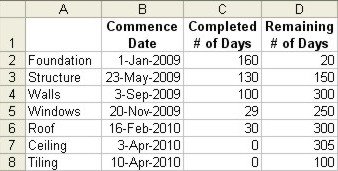
Usually a Gantt chart needs a time guide, as in days or hours. Following is an example of data that would be sufficient enough to create a simple Excel Gantt chart.
 |
From the above data a simple Excel Gantt chart can be created.
 |
Creating An Excel Gantt Chart
Following are the steps used to create an Excel Gantt chart from the above given data table.Do 1st... (Create data)
| 1. | Type the sample data given above on a new worksheet in cells A1 through to D8. | ||||||||||
| The values in columns C and D ("Completed # of Days" and "Remaining # of Days") represent numbers of days. | |||||||||||
| 2. | Format the dates used in column B to the format that you want. | ||||||||||
|
|||||||||||
Do 2nd... (Create Chart)
| 1. | Create the Stacked Bar chart using the Chart Wizard | ||||||||||
|
|||||||||||
Do 3rd... (Customize Chart)
| 1. | ► Double-click the first series in the chart. This is the series
for Commence Date. As default, it's the blue part of the bar
chart. ► Click the Patterns tab. ► From the Border options, click None. ► From the Area options, click None. ► Click OK. |
|||
| 2. | ► Double-click the category (x) axis, which in a bar chart is
the vertical axis - the axis with the words. (In
a bar chart, the traditional x and y axes are reversed.) ► Click the Scale tab, and checkmark Categories in reverse order. ► Click the Font tab, and choose 8 from the Size list. ► Click OK. |
|||
| 3. | ► Double-click the value (y) axis, which in a bar chart is the
horizontal axis - the axis with the dates. After
completing the last step, this axis should be located at the top
of the chart plot area. ► Click the Scale tab and type the following values in the appropriate boxes:
► Click the Font tab, and choose 8 from the Size list. ► Click the Alignment tab, and under Orientation, type 90 in the Degrees box. ► Click OK. |
|||
| 4. | ► Double-click the outline of the
Legend. ► Click the Placement tab, and choose Bottom. ► Click OK. |
|||
| 5. | ► Click the words "Commence Date" in the Legend
so that only the single words are selected. (You'll know it's selected by the 8 selection squares at each corner and side of the words "Commence Date".) ► Press the Delete key on the keyboard. |
After doing these steps, your Excel Gantt chart should look like the example given above.
Resize the chart as needed.
You can also format any other aspect of the chart as needed.
| See also... Charting Elements for more information on charts |
| Back to Top |
| Return to Excel XP from Excel Gantt Chart |
Excel XP Topics
- Tips- Excel Screen Layout
- Navigational Techniques
- Working with Workbooks
- Templates
- Working with Worksheets
- Moving Around
- Move Worksheets
- Copy Worksheets
- Insert & Delete Cells
- Insert & Delete Rows
- Insert & Delete Columns
- Resize Row
- Resize Column
- Editing Data
- Content Color
- Cell Color
- Number Formats
- Fonts
- Alignment
- Text Direction
- Indent Contents
- Merge Cells
- Copy
- Move
- Undo & Redo
- Using Zoom
- Freeze & Unfreeze Titles
- Split Worksheet
- Spreadsheet Data
- AutoFill
- AutoComplete
- Comment
- Find
- Replace
- Spellcheck
- Formulas
- Functions
- Password
- Sorting
- AutoFilter
- Advanced Filter
- Macros
- Charts
- Charting
- Charting Elements
- Gantt Chart
- PivotTable
- PivotTable Calculations
- PivotTable Layout
- PivotTable Format
- PDF to Excel
- PDF-to-Excel Converter
- Excel to PDF Converter